
Home
Jobs
Products
About Us
Contact Us
Site Map
Investors
Press
FAQ
Pedjo now has sufficient capital. The discussion and analysis here primarily relates to additional investments which may from time to time occur as the company grows.
Summary of Content:
By way of background, a broad and useful overview of other SEC regulations influencing stock sales by small corporations can be found here. The Securities Act exempts from registration "transactions by an issuer not involving any public offering."
Five laws, sometimes not widely known, influence Small-Corporation investing:
1) SEC Relaxes Ban on Advertising and Solicitation for Private Placements to Accredited Investors
In a highly readable explanation, Robert A. Friedel points out that:
In a watershed event reversing decades of private offering restrictions, on July 10, 2013, the Securities and Exchange Commission (SEC) approved final rules required by the Jumpstart Our Business Startups Act of 2012 (JOBS Act), eliminating the prohibition against “general solicitation and general advertising” in certain securities offerings conducted pursuant to Rule 506 of Regulation D and Rule 144A under the Securities Act …
As mandated by the JOBS Act the SEC removed the prohibition on general solicitation or general advertising for securities sold to accredited investors through the adoption of new Rule 506(c), which allows general solicitation and general advertising, provided that:
the issuer takes reasonable steps to verify that the purchasers of the securities are accredited investors, and all of the ultimate purchasers of the securities are accredited investors, either because they come within one of the enumerated categories of persons that qualify as accredited investors, or the issuer reasonably believes that they do, at the time of sale. For purposes of Regulation D, an accredited investor is defined as, among other qualifications, an individual who has income of at least $200,000 in each year of the last two years (or $300,000 together with his or her spouse if married) and has the expectation to make the same amount in the current year, or a $1 million net worth excluding the value of his or her primary residence.”
2) Employee Stock Ownership Plan - ESOP § 4975(e)(7).
While an ESOP has many attractive features, costs and management aspects presently make it unattractive for us: "The cost of setting up an ESOP is also substantial—perhaps $40,000 for the simplest of plans in small companies and on up from there."
3) Section 1244 potential small-business loss reductions.
For qualifying small-business corporations and subject to a variety of limitations, the Internal Revenue Service Section 1244 pages allow, after 5 years, individuals or partnerships who "have continuously held the stock from the date of issuance" to in the event of losses on a sale or exchange of §1244 stock to treat such a loss as an “ordinary loss” rather that a “capital loss.” “Capital losses” deductible at the rate of $3,000 each year can be converted to a more rapid rate of deduction in instances where Section 1244 qualifications are satisfied. At a 35% tax bracket such an application might well result on a $3,500 tax reduction on a $10,000 “ordinary loss.”
Do not rely on this or take it as tax or investing advice. Rules under §1244 are highly complicated with many requirements that can render them inapplicable. Contact your tax advisor to see how rules would apply in your case.
4) Dividend regulations. Delaware code indirectly states the plain case that funds available for lawful dividends are calculated as follow: Funds available = total assets - total liabilities - par value of issued stock....
The formula's relationship to Pedjo, plainly spoken: “Par value” of stock is an arcane concept seldom corresponding to reality. However for purposes of dividend distributions, we address its influence here. For example, the 50,000 shares of Pedjo, PBC stock have a par value of $0.001 each, a total $50 [50000*$0.001= $50]. This comes into play for purpose of paying a dividend in the formula above: “Funds available for paying dividend = total assets - total liabilities - par value of issued stock.” Substituting in present values gives: “$149,950= $150,000 - $0 -$50.”
5) Public Benefit Corporation Code.
Pedjo, PBC has sold 1,500 shares for $150,000, $100 each.
These funds have allowed Pedjo, PBC to purchase and renovate the Signet Bank building property, which it owns outright with no debt.
Pedjo's large cash outlay without any debt and its stock value that closely corresponds to dollar value of expense incurred is intended to send a message: From the outset the intent is to signal investors and those that work with the corporation that this corporation does not intended to engage in foot-lose stock manipulations. By contrast, each share is intended to reflect a true value, a value which at least in part is backed up by the obvious value of the real estate (the Bank building) and the value of the corporation as a whole.
The section 4 formula above makes it possible for Pedjo to use old-school concepts that favor a rational dividend on funds invested. Having roughly $149,950 available for dividend distribution obviates the need for calculating profit in order to make dividend distributions at contemplated levels.
High Dividends.
One of the irritants of recent years is the bemoaning of low dividends. Main methods for rewarding stockholders of large publicly traded stocks now appear to be, in ranked order: 1) a growing stock price, 2) buy backs, and lastly, 3) dividends. As the Economist states:"buy-backs have usurped dividends as the main way listed American firms give money back to their owners, accounting for 60% of cash returns last year. Even in Europe and Asia, where dividends tend to be venerated, buy-backs have become more common in the past decade."
These three methods of rewarding investors are taken so much for granted that we seldom broach the subject that the first two are almost entirely reliant on corporation growth. There are many instances where growth is inapplicable or undesirable in a smoothly functioning business.
For a thought experiment, take the example of a well-run farm operating at maximum efficiency year after year. In many instances its revenues and profit may be adequate, but not on average grow, even though it is a good and worthwhile enterprise. And in times of economic downturns it may indeed produce scant returns, notwithstanding its long-term value. I propose that dividends are the most adaptable mechanism for rewarding the investor. Unlike the other forms of reward, it is capable of compensating the investor under widely ranging conditions, with or without growth. Reliance on the other two forms, which stress growth, do not have this attribute.
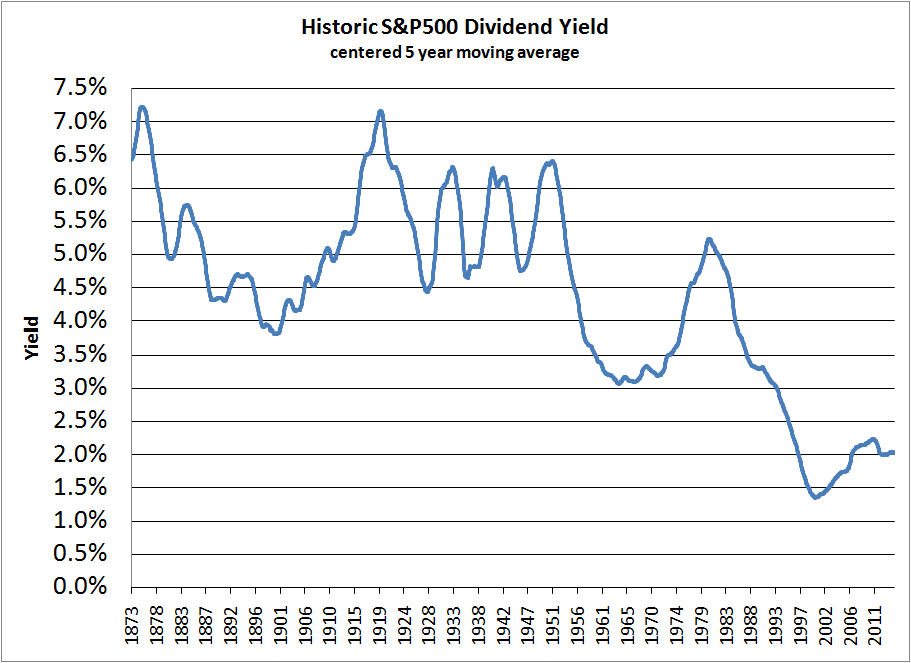
Over the long throw of history, dividend culture has dramatically changed. The period after the Civil War at the beginning of the US industrial revolution and continuing into the mid 20th century is instructive.
Then high dividends were often a key investor incentive to prop-up stock price. That practice from time to time gave rise to accusations that dividends were excessively high, explicitly for purposes of unduly inflating stock value (p. 365, 393, 419, 546, Titan). From 1873 to 1957 dividend yields in the 4% to 7% range were common [based on Shiller data set]. An ongoing proof of concept is that the average dividend yield in the foreign developed world is 4% — twice the S&P500 yield. (p. 252, Carrel) The historical record serves to illustrate that firms can be capitalized to function well and simultaneously deliver high dividends.
The practice of being sufficiently stable to lay your hands on cold hard cash to make dividend payments enforces discipline in financial management. This is the polar opposite of "creative-accounting" machinations and other slights of hand to enhance shareholder value in publicly traded stocks (pp. 156-173, 256-259, Dilives).
In today's world, there are two explicit causes for low dividends:
1) The dividend payout ratio prior to 1971 was on average uniformly 53%+. But by the early 2000's it dropped to roughly 35% (p. 159, Dilives).
2) Since July 1991 stock PE ratios have dramatically increased to often be about 20 or higher. (pp. 156-160, Dilives)
Dividends paid from profits are determined by PE ratio and payout ratio. Combining current PE and Payout ratios produce roughly a 1.75% dividend as can be seen in this calculation: 1.75%=1/20*35%.
By contrast, an old school 16 PE ratio and a 53% payout ratio resulted in a 3.31% dividend: 3.3125%=1/16*53% — roughly equivalent to S&P500 dividends paid in the 1962 to 1972 era. While higher dividends can be paid in some circumstances, a base yield in this neighborhood seems to be a sensible starting point.
S&P500 Rate of Return.
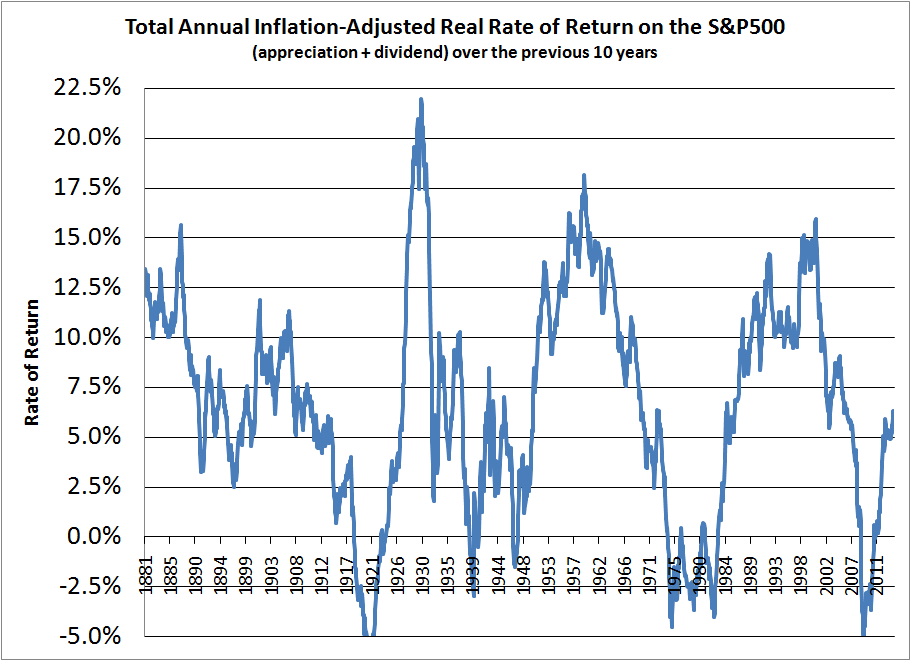
The graph looks like a mess doesn't it. The variability in real inflation-adjusted values gives a sense of the wild ride that one can expect from the S&P500. Some points, although counterintuitive, are true. The highest ten year rate of return was at the beginning of the Great Depression. This resulted from the 10 year appreciation starting at a low point in 1920.
But all of S&P500 history can be distilled to its average 6.6% rate of return before inflation and an 8.9% rate of return when a common 2.3% inflation rate is included. Using dividends alone to compensate investors by adding 6.6% to the prevailing rate of inflation to create dividend yield is at least a rational approach for compensating the investor at a rate of return roughly commensurate with long-term S&P500 history [based on Shiller data set].
And you may ask: Where did that 6.6% rate of return come from? Well, a 2.2% rate of return came from appreciation and a 4.4% rate of return came from dividends. Yes, for all of US stock market history, twice as much return came from dividends as came from increases in price. The modern era is an anomaly, and not a welcome one at that.
Bond Interest Rates.
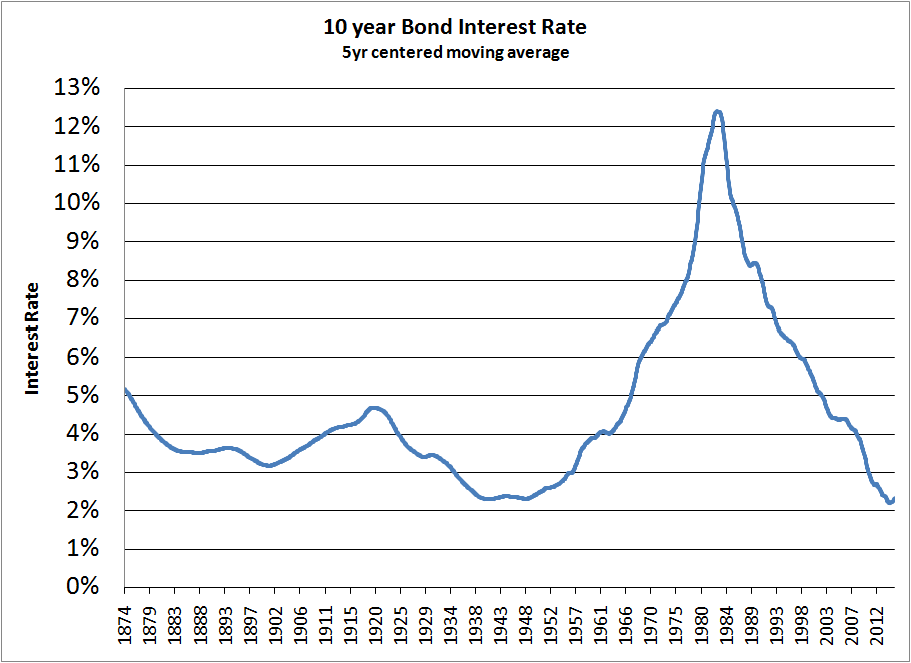
The determination of an appropriate dividend is also related to rates of return from different asset classes, bank prime rates, et cetera. In the main the appropriate floor is set by a 10 year Treasury bond rate (not adjusted for inflation) such as the one shown above [based on Shiller data set]. If dividends were to fall beneath the prevailing long bond rate, investors would tend to feel they were getting a disproportionately low rate. The extreme peak from the late 1960s to mid 1980s was atypical and caused by acute inflation. Normally an appropriate floor would tend to be in the 2.3% to 4.6% range.
The spread above the bond rate for determining dividend can rationally relate to risk, rate of inflation, S&P500 rates of return, other calculations, or long-term differences between stock and bond rates of return.
The graphs and discussion here are not intended to give a definitive answer, but to illustrate there are many logical ways to set reasonable dividend rates. Once a dividend rate is generally known, the dividend then can be factored into the management process as one of the many "costs of doing business." So long as the dividend determination is sensible, it is hoped that the investor will be satisfied and other aspects of the business can proceed knowing that the investor has been taken care of.
Focusing on dividends as the means for rewarding investors has another big pay back. The CEO and management need not waste time bolstering stock values by an ever going, albeit an indirect sales pitch. Nor do they need to look to mergers to raise their bottom line (p. 390, note 186, Dilives). Instead, they can focus on the job at hand: appropriately running a company and producing fine and innovative products.
Small Corporation Dividend Yield.
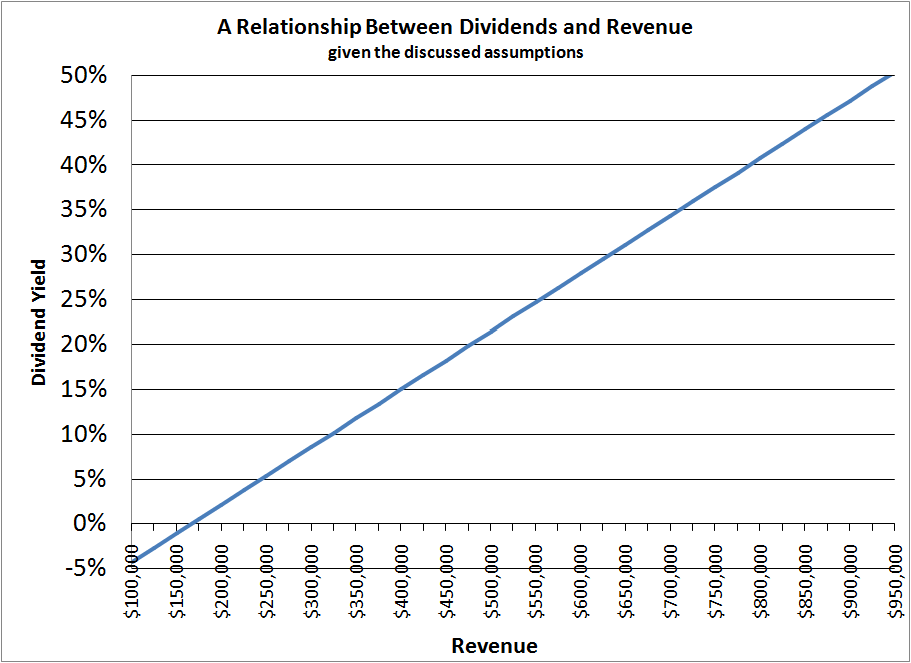
The above graph plainly does not correspond to real world circumstances, but it does represent the consequences of the following assumptions: a firm with a $200,000 capital investment, where dividends are determined by a 0.53 dividend payout ratio and where profits are determined by $40,410 fixed costs and variable costs (including material and labor) at 76% of revenue [based on Annual Survey of Manufactures (ASM) data]. In the case under consideration, the firm owns a 10,900 sq ft building — ample space to support revenues throughout the shown range.
The model produces the following teaching points.
1) Under these circumstances, the firm will not break even until revenue reaches $175,000 annually.
2)
It can only comfortably support a 3.31% dividend yield when it reaches roughly a $225,000 revenue.
3)
With a $275,000 revenue, the firm can support a 7% dividend — substantially the highest common-practice average dividend in all of S&P500 history.
4) A $350,000 revenue can sustain an 11.8% dividend — a dividend higher than a common S&P500 8.9% rate of return.
5) In Pedjo's case, much of what we call dividends here is effectively a rental payment that the corporation is making in exchange for its founding stock investment that made it possible to purchase free and clear the building in which it operates. To fail to make that payment would be analogous to failing to pay the rent.
6) The model may fail to consider some expenses which can produce results less optimistic than shown.
7) It is anticipated that the curve will bend downward with increasing revenues as the firm takes on more expenses to cover additional product development and operational costs.
Lifespan.
Long, long ago in 1935, the average lifespan of a S&P500 company was 90 years.
They are no longer so long-lived. As innosight.com graphs show in 1958 it was 61 years; in 1980, 25 years; now, only 18 years. And these are huge firms.
Let me again make a plug for emphasizing stockholder dividend compensation. It certainly did no harm in prior eras. Companies seemed to have survived quite long and happily with it vis-à-vis shorter-lived modern corporations, replete with their buoyant stock prices, low dividends, and armies of MBAs (p. 255-56, Dilives).
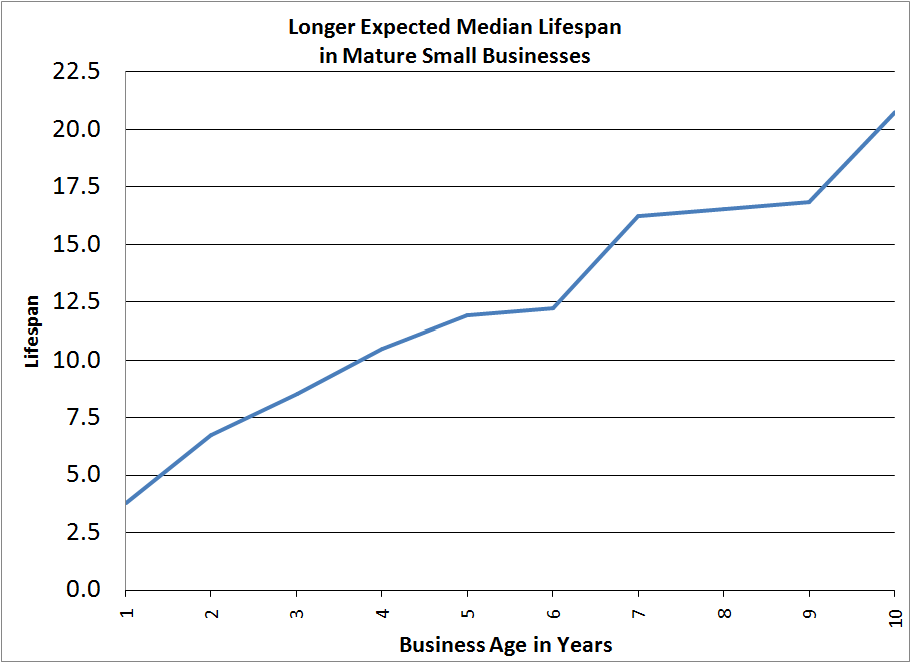
The 18 years average life for a S&P500 firm closely approximates expected life of small businesses with 7 to 10 years of experience under their belt. Under the right conditions, a small business with staying power can be every bit as remunerative and sound for its stockholder as a S&P500 investment.
It is well known that small businesses have a high failure rate. For example, Scott Shane shows that one in four fail in the first year and half fail within the first 5 years (p. 99, Fig. 6.2). But this fact masks the resilience of small businesses that have proven themselves by existing for many years.
Using the same data with k-process methods produced the above graph. The graph suggests that after the weeding out, there remain resilient core of small businesses worthy of serious consideration.
Again, using the same data, we can dig deeper:
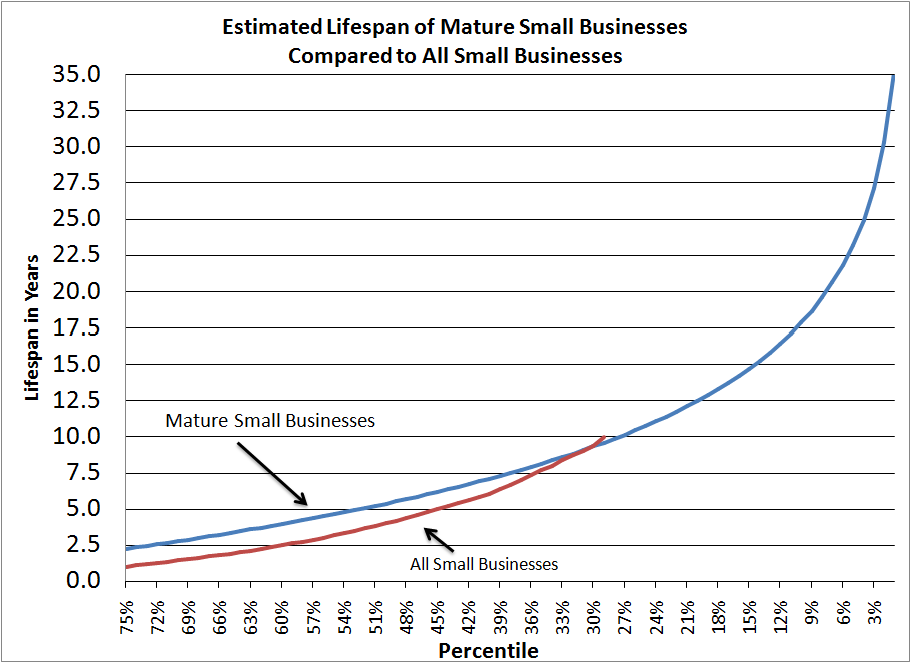
Assuming, as seems to be the case, that small businesses startups fail in a roughly predictable pattern consistent with what is known as "waiting time problems," the above graph was made with the same data as before using k-process methods. It suggests that all of the top 10% of small businesses will survive longer than the average S&P500 firm and that the top 24% of all small business startups taken together have the same average 18 year life as in the S&P500.
This is striking because 5,008 companies are traded on major U.S. stock exchanges, 10% of them being S&P500 firms — valued at average stockholder investment of $38.8 billion each. Even with all of their financial and managerial horsepower, this 10% select publicly-traded group still averaged a lifespan that seems to be equaled by 24% of small businesses startups, and almost certainly was surpassed by 10% of small business startups.
Perhaps what we can take home from this is that running any business — large or small — is a risky undertaking requiring a superior performance just to survive. More particularly, maturely run small business startups seem to have had in each year about a 1.2 year survival advantage over all small business startups taken together. But this advantage did not provide immunity. Maturely run small businesses seem to terminate at about a rate of a one in 7.75 chance in each year. And the group of all small business startups, on average, terminate at a rate of one in about 5.8 to 7.1 chance in each year. [The red, "All Small Businesses" graph curve duplicates data in Scott Shane's chart.]
It is also well to keep in mind that firms terminate for numerous reasons — sometimes favorably, sometimes not. More positively, there seem to be a small core of about 2% of small businesses startups that can be expected to survive about 33 years or more.
Putting these graphs and comments in the open is intended to draw attention to the public benefit purpose of the corporation and the competing interests that it faces. Owners of capital need a fair return on their investment. Workers need a fair return on their work. Customers need a fair price for the products they buy. These and other competing interests all need to be taken into consideration to achieve a "best" reasonable mix, knowing full well there is never a "fair" that will perfectly satisfy all. At best it is a question of attempting to achieve the best reasonable mix achievable under circumstances as they unfold — while holding a public-benefit-corporation philosophy that has as its objective the always elusive goal of fairness. It is a philosophy attuned to Wendell Berry's precept: "to grow like a tree, not like a fire" (p. 201, Art of the Commonplace).
Knowing monetary constraints is important in a small corporation because small business stock usually is not publicly traded, which is to say characteristically it is not as liquid as a publicly traded stock. [Liquidity refers to the ability to convert an asset to cash quickly, usually in a wide market]. A lack of liquidity puts pressure on a small-business corporation to plan for and look elsewhere for financial advantages to satisfy an investor. Dividends that are regular and sufficiently high seem to be the most suitable means for doing this.
A dividend of $3.31 for each share generally corresponds to an old-school, higher-dividend mode. A starting 3.31% dividend compares favorably with publicly traded bond and stock yields. And, as previously indicated, a growth in revenues to a level sufficient to support an 8.9% yield seems appropriate and desirable. The objective is to give investors a laudable return, but not to enrich them.
There is no magic here. No company can pay dividends over the long term without sufficient profits and revenue. Nor is a stock attractive if a company fails to thrive financially. But so long as a closely held company can indeed deliver a PE ratio of 16 or lower (earning one unit of profit to stockholders for each 16 units of capital), it has the potential to indefinitely flourish, because it has sufficient profits to back it up.
Further a 53% payout ratio implies 47% retained earnings [100%-53%=47%]. Retained earnings of this magnitude are sufficient to bolster company growth and attending dividends, as they did in stock market history prior to 1971. There is no novelty or magic here. The technique has already been proven on a large scale in stock market history prior to 1971.
Regardless in view of dividend regulations, a well funded new company would seem to have a little breathing space from the outset to make dividends possible in lean and flourishing times alike.
A low PE ratio in a closely held corporation contrasts with high PE ratio objectives in many publicly held corporations. An investor in a high PE ratio company benefits because the potential selling price is large relative to the tiny profit on which it is based. For example, a PE ratio of 20 produces one unit of profit for each 20 units of capital. A high PE philosophy derives its advantage from selling a stock.
In polar opposite fashion, a low PE ratio derives its advantage by holding the stock. For example, one unit of profit for each 16 units of capital is well within the capacity of closely held corporation that can produce a higher profit on a lower investment. PE ratios at this level or lower are as beneficial now as they were in publicly traded stocks throughout nearly all of US stock market history prior to July 1991.
As desirable as low PE ratios are in a small corporation, they attract predators. Well-funded companies become a target for takeover artists desiring to enrich cash-poor high-PE-ratio companies (p. 256, Dilives). To nix this, all Pedjo voting stock is closely held.
And, as stated in the Certificate of Incorporation, “The rights, preferences, powers, privileges, and the restrictions, qualifications and limitations of the Non-Voting Common Stock are identical with those of the Voting Common Stock other than in respect to voting and both Voting and Non-Voting Common Stock together shall constitute a single class of shares of the capital stock of the Corporation.” Having the two equal except with respect to voting reduces the potential for self-serving actions of voting shareholders, because they like non-voting shareholders have an equal per share financial interest in the company.
Further, as most investors who hold many stocks soon come to see, their vote is usually meaningless. In the main, neither they nor other shareholders in publicly-traded corporations have the time to research issues or to know the Officers and Directors of each company they are invested in. More often than not their investments may be pooled in funds that further remove them from active decision-making. Adam Smith (substantially the father of free market) too in his quaint way recognized the problem in the Wealth of Nations:
But the greater part … seldom pretend to understand anything of the business of the company… [they] give themselves no trouble about it, but receive contentedly such half-yearly or yearly dividend as the directors think proper to make to them. This total exemption from trouble … encourages many people to become adventurers in joint-stock companies… . Such companies, therefore, commonly draw to themselves much greater stocks … . The divided capital of the Bank of England amounts, at present, to ten millions seven hundred and eighty thousand pounds. The directors of such companies, however, being the managers rather of other people’s money than of their own, it cannot well be expected that they should watch over it with the same anxious vigilance with which the partners in a private copartnery frequently watch over their own.... Negligence and profusion, therefore, must always prevail, more or less, in the management of the affairs of such a company. …they have commonly mismanaged the trade.
At least with a small closely held company you can know the voting shareholder, Officers, and Directors. By this means, you have a chance of to be generally aware of the intentions behind decisions that are made.
These are some of the driving motives behind the company. The calculations and information may also be helpful for Makers running their own businesses, perhaps also making Pedjo bikes and bike components.
This discussion is intended to support the public benefit purpose of the corporation by specifically illustrating problems and seeking to strike a balance between investors' need for an adequate return on an investment and workers' need to know that they are being compensated fairly relative to investor compensation.
For those of you who like practical examples and have little interest in financial doings, perhaps the following approach may interest you:
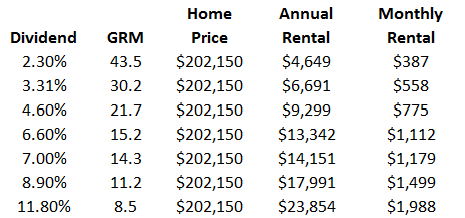
Take the estimated value of a piece of rental property and divide it by the annual rent paid. The result gives you what is known as the Gross Rent Multiplier (GRM). It, too, reflects a rate of return that an owner of capital (the landlord) receives.
Try dividing GRMs into your home's value to see what would strike you as an appropriate rental value. Keep in mind that a landlord faces numerous expenses and management concerns that an owner of capital does not. And on the other hand, after a mortgage, his net worth may be lower than an outright owner of capital. So in a fair world, these components would need to be accounted for. In any case you may find this little exercise amusing and it may jostle your thinking about what an appropriate return on capital is.
In 2014 the median price of homes that sold in the United States was $202,150. The median monthly rental was $1,475 ($17,700 annually) for a GRM of 11.4. Previously discussed dividend yield percentages are shown in the following paired with their GRM equivalents [GRM is inverse of percentage].
Though the analogy certainly is not exact, the owner of capital in a small business, too, must receive payment for the use of his or her capital. In a sense, he or she is also a landlord of capital.
Over time the emphasis of the discussion here may change, but the ongoing intent is to act sensibly in the face of competing interests and events as we see them.
March 2015